'Married puts' - foundation of a profit machine (part 3)
How to time entry into a 'married put' position in order to achieve the lowest cost and minimum risk
Timing an entry.
Obviously, a falling stock price will increase the price of put options. However, on balance, this increase in the price of the puts is more than offset by the reduced price to buy the stock and I have found that entering a 'married puts' position is very similar to buying stock - 'buying the bottom' pays off big time, but without the associated risk of a stock only position.
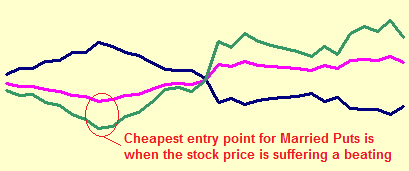
Consider the following chart. I produced this chart using live data taken at various random times over a five day period on FCX (Freeport mining). At each data point I noted the price of the stock, the price of the $40 strike put option (10 months to expiry) and, most importantly, the risk limitation offered by the position.

| Blue line = Price of 40 strike put option. |
| (Ranges from 8.65 to 11.45) |
| Pink line = Current stock price. |
| (Ranges from 36.64 to 43.63) |
| Green line = Maximum risk |
| (Low is good - Ranges from 809 to 1228) |
For example; when the stock traded at $36.64, the put option cost $11.45 and the maximum risk of entering a married put was, therefore, $809 for the 10 month position. In other words, if I did nothing but hold the stock and put until expiry and the stock plummeted I could get out by exercising the put and selling the stock for $40 for a maximum loss of $809 on the position. Of course, simply holding the stock and put to expiry is not how I achieve best results but the foundation of my strategy is the 'married put' and a neat entry can make quite a difference to potential profits.
Below is a table showing the actual data. I have highlighted the cheapest 'married put' entry, and the most expensive. Note that the best entry point is also the cheapest stock price. In brief; we follow the stock price looking to enter at the bottom of a dip. Of course, that is easier said than done. In practice, I find it best to enter on a small uptick in the stock price following a heavy decline. In the example below, we would like to be in a position with maximum risk of, say, less than $900. It is simply unrealistic to expect a perfect entry every time, but I hope that the information in this article can help improve everyone's results on 'married puts'.
Note that the difference between the high and low for maximum risk on this real example is more than $400 - that is quite a help, or hindrance, to an overall position as this is the number we try to eliminate altogether over the weeks following an entry.
How are the numbers worked out?
The data to produce the chart, above, is taken from the table below.
Each line of the table is comprised of a price to buy 100 stock and the price of a $40 strike put option at the same time. The put option acts as insurance that we can sell the stock for $40 by exercising the option, but there is a premium paid to purchase the option. The maximum potential for loss is entered into the table and chart, too. Please note that commissions are not factored into this data.
Example:
Stock price x 100 shares - ($39.35 x 100 = $3,935)
Put Option x 100 shares - ($10.20 x 100 = $1,020)
Amount recoverable from $40 strike option = $4,000
Maximum loss = recoverable ($4,000) minus cost of entry ($4,955) = -$955
| Date | Stock Price | Jan 2010 $40 put | Maximum risk of loss |
|---|---|---|---|
| 3/30/2009 | 39.35 | 10.2 | 955 |
| " | 38.94 | 10.45 | 939 |
| " | 38.98 | 10.45 | 943 |
| 3/31/2009 | 38.40 | 10.70 | 910 |
| " | 38.23 | 10.75 | 898 |
| " | 37.60 | 11.05 | 865 |
| " | 37.42 | 11.05 | 847 |
| " | 36.64 | 11.45 | 809 |
| " | 36.89 | 11.30 | 819 |
| " | 37.52 | 11.05 | 857 |
| 4/01/2009 | 37.77 | 10.95 | 872 |
| " | 38.48 | 10.65 | 913 |
| " | 39.20 | 10.40 | 960 |
| " | 39.35 | 10.35 | 970 |
| " | 39.19 | 10.35 | 954 |
| " | 39.93 | 10.05 | 998 |
| 4/02/2009 | 42.34 | 9.10 | 1149 |
| " | 42.00 | 9.25 | 1125 |
| " | 42.75 | 9.05 | 1180 |
| " | 42.27 | 9.20 | 1147 |
| " | 42.07 | 9.25 | 1132 |
| " | 41.90 | 9.30 | 1120 |
| " | 41.75 | 9.35 | 1110 |
| " | 41.45 | 9.45 | 1090 |
| 4/03/2009 | 42.15 | 9.15 | 1130 |
| " | 41.67 | 9.30 | 1097 |
| " | 42.90 | 8.90 | 1180 |
| " | 43.20 | 8.85 | 1205 |
| " | 43.01 | 8.85 | 1186 |
| " | 43.63 | 8.65 | 1228 |
| " | 42.68 | 8.95 | 1163 |
In the next article of this series, I shall discuss the effect of time on the price of puts and how this affects the married put position. Choosing the right expiry date for an option is not difficult, but it can have quite an influence on the overall results.
You can jump to Part 4 of this series by clicking below...